Immersive Visualization Institute (IVI) Celebrates 5 Years
Many people don’t realize that Michigan State University (MSU) has a robust “ecosystem” of immersive data visualization technologies available to students and faculty. These include the Abrams Planetarium Sky Theater, the 360-degree panoramic display space in the MSU Libraries’ Digital Scholarship Lab, and the MSU Museum’s Science On a Sphere®. Together, these technologies offer unique opportunities for teaching, learning, and research. They are rich in possibility for multi-media engagement and custom content creation by members of the MSU community.
The Data Visualization Ecosystem at MSU
Data visualization technologies communicate information through layering media like images, video, sounds, and animations. They make complex data more understandable by helping people see patterns and make connections. Visualizations can create engaging and deep learning experiences. “While traditional education typically draws a distinct line between creative storytelling and technical analysis, the modern professional world also values those who can cross between the two: data visualization sits right in the middle of analysis and visual storytelling”.
Learn moreAbrams Planetarium Sky Theater
The Sky Theater is located inside the Talbert and Leota Abrams Planetarium. The theater is a round room with a hemispherical domed ceiling, approximately 50 feet in diameter. It seats 141 people. The dome is made of whitepainted, perforated aluminum and serves as the projection screen for 2 laser phosphorous projectors and runs the planetarium software known as Digistar 7.
360-Degree Panoramic Display Space

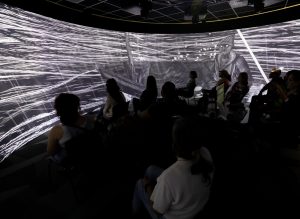
The 360° Space is housed in the Digital Scholarship Lab at the MSU Libraries. It was developed and installed by Igloo Vision, which has developed distinct pieces of software that handle specific content types, such as google street view and video content. The system uses a 360° screen that surrounds the user, audio, and a video projector to create immersive experiences.
Science On a Sphere
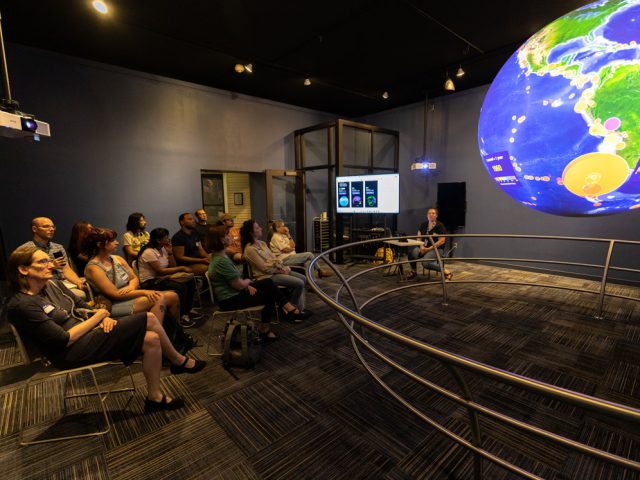
Science On a Sphere (SOS) was developed by the National Oceanographic and Atmospheric Administration (NOAA). The SOS gallery at the MSU Museum showcases a six-foot diameter globe and four projectors that allows users to explore earth sciences and other natural and social phenomena through datasets and animations. Visitors can access content using the self-service touchscreen or participate in a facilitated program with an educator.
What is the Immersive Visualization Institute?
Since 2019, the Abrams Planetarium, MSU Libraries, and the MSU Museum have co-convened a summer institute focused on providing a 4-day opportunity for a cohort of graduate students and faculty mentors to explore the pedagogic possibilities of the three exciting large-scale immersive visualization platforms at MSU. The program began in June 2019 as the “Digital Storytelling with Large-Scale Digital Learning Technology Platforms” summer institute. The MSU Museum had not yet introduced its Science.
On a Sphere system (it would be installed in October that year), so the Detroit Zoo hosted a session with their SOS located inside the Wildlife Interpretive Gallery. In 2020, the MSU Graduate School began sponsoring the program, investing in this learning opportunity by providing $500 stipends for each graduate student participant. Renamed the “Immersive Visualization Institute” (or IVI) in 2021, the program has been offered every summer (2020 and 2021 were offered virtually due to the pandemic).
 Applicants were invited from across the entire University, and all disciplines and interdisciplinary perspectives are welcomed. Graduate students could apply individually or with a faculty member mentor. IVI participants learned about the affordances and limitations of each technology and how they are best suited for different types of visual representation. Participants investigated techniques for producing content for the displays and developed interdisciplinary ideas for capitalizing on one or more of the platforms. By the end of the summer, participants were expected to produce an outcome using the technologies, such as a teaching module, outreach program, research study design, or work of art.
Instructional and peer workshop sessions helped participants reach their goals. The facilitators demonstrated the data visualization systems and taught participants how to design for them. Sessions have included 360 camera use, choropleth mapping for the Science On a Sphere, Camtasia, and Google Cardboard. Special speakers led discussions about pedagogy, Augmented Reality, Virtual Reality, and the Libraries’ Anatomage Table.
Who has participated?
Each year, making IVI a success is the result of bringing together talented facilitators, graduate students, and faculty members. IVI really isn’t a program; it’s the sum of the interactions of everyone involved. The diversity of participants has helped make IVI different and exciting every time. Participant selection is competitive with a limited number of participants (usually 10-20). Between 2019 and 2023, participants included 47 graduate students, 15 faculty members, 1 post-doctoral research associate, and 1 invited undergraduate student. These numbers represent 33 MSU units, departments, and programs:
|
|
Current and former IVI program coordinators/facilitators include:
- Dr. Denice Blair, Director of Education, MSU Museum
- Teresa Goforth, Director of Exhibitions, MSU Museum
- Terrence O’Neill, former Director, Digital Scholarship Lab, MSU Libraries
- Dr. Shannon Schmoll, Director, Abrams Planetarium
- Dr. Amanda Ticker, GIS Librarian, MSU Libraries
- Carrie Wicker, Museum Educator and SOS Coordinator, MSU Museum
IVI Outcomes
What happens because of the Immersive Visualization Institute? First, participants have great experiences. When asked what they liked best about IVI, IVI alums responded:
- “Getting exposed to the technology MSU has available for staff/students that I had previously never heard of before.”
- “I really appreciated the sessions, there was just so much to learn. I especially appreciate being able to learn in a cohort setting.”
- “I am excited to use my project as a teaching tool and also a potential line of research that could guide other programs to use it with their students/in their programs.”
- “The tools that I learnt to use during the immersive visualization institute will expand my abilities to communicate concepts associated with my research to my peers but also the broader audience. From my perspective, outreach is a crucial component of science that is somewhat neglected in the training of scientists, and I will…use what I learnt during that week to enhance my ability to communicate science better.”
Second, the participants produced a variety of great projects. Examples from each of the ecosystem technologies include:
- “An Immersive Introduction to the Amazing World of Islamic Design” (Planetarium)
- “Lesson Plan – Bodies in Space: Imagining Shakespeare’s Settings in 360” (360 Display)
- “Species Delisted from Endangered during the Pandemic – Art Prints” (Science On a Sphere)
Finally, the co-convenors have highlighted benefits of IVI to them as scholars, outreach practitioners, and educators. Shannon Schmoll, co-convener and director of the Planetarium, noted,
“Each technology – the Planetarium, 360 Room, and Science On a Sphere – have complementing strengths. Coming together with the amazing folks on campus in order to explore incredibly creative ways of making the technology help teach is always fun and engaging. It helps me push my understanding of what my system can do, and I always learn more about my colleagues’ work.”
Amanda Tickner, co-convener who works with library patrons the 360 Room, summed up the importance of IVI:
“Collectively exploring the potential of immersive displays for education and sharing ideas during the Summer Institute was a valuable and exciting experience.”
Future Goals
The Immersive Visualization Institute provides everyone involved the opportunity to get to know MSU’s data visualization ecosystem and learn about the possibilities for creating deep, engaging experiences. Because helping people understand and interpret data is so important, we want to continue offering this summer institute in the coming years. In Spring 2024, the Graduate School generously committed to five more years of support for IVI.
Photo credit: Aaron Word